Management reporting over your General Ledger
See where every number
in your business
comes from.
Wevo is a management reporting layer over the General Ledger you already run. It organises your figures the way you actually run the business - by division, cost centre and account - and lets anyone who owns a number click straight through to what sits behind it, in under a second. Minutes behind your ledger, not a night.
One fixed monthly fee from £5,000 · Unlimited users and report recipients · Runs on one ordinary server, inside your own environment
Works alongside the GL you already run - SAP · Oracle · Dynamics · Sage · any standard system
Wevo at a glance
What it is
A management reporting layer over the General Ledger you already run.
What it replaces
Nothing. Your GL, consolidation, EPM and BI tools all stay exactly where they are.
How it connects
CSV extracts on your schedule. No live connection to your GL and no access to its database.
How current
Minutes behind your ledger, not a night. There is no overnight batch to wait for.
What it costs
From £5,000 a month, fixed. No per-seat charge, no data-volume charge, no modules.
Where it runs
Inside your own environment - cloud, hybrid or on-premise - on one ordinary server. Source code included.
Your accounting system records every transaction as a flat list. Your business runs on structure - divisions, teams, cost centres, account groups. Wevo rolls every posting up through the structure you define, so the person who owns a number can see straight through it to the detail beneath.
The cost of the current way
Same question.
Two very different mornings.
A financial controller spots a £241k overspend on materials and needs to know why before the board pack goes out. Here is how that morning goes on either side of the divide.
Reporting a night behind
Five hours gone · board pack delayed
Two manual exports · one batch re-run
Reporting minutes behind
Sixteen minutes · board pack on time
No exports · no batch runs
The licence fee arrives on an invoice. The real cost - decisions delayed, closes extended, analyst hours lost to reconciliation - never appears anywhere. See what batch reporting quietly costs →
What you get
Four things that change
the working day
Instant drill-down
From a summary to the transactions in one click
Because the totals are worked out in advance, the answer is already there. Click a division, a cost centre or an account group and the detail behind it appears. No export, no support ticket, no wait.
Your structure, your chart of accounts
Move through both at the same time
Set your organisation against your chart of accounts and read any combination of the two - a cost centre's overheads, a division's revenue, the whole group. Change either structure yourself, without an IT request.
Minutes, not overnight
No batch to wait for
Small, frequent extracts keep the reporting current to within minutes of your ledger. A late journal during month-end close shows up without anyone re-running anything.
Reports by email
Budget holders get their numbers without a login
Managers receive a request form by email, set the parameters in the browser, and the finished report comes back within seconds. No licence seat, no training, no limit on how many people you send to. See how it works →
What changes for the business
Not features.
Four fewer problems.
The close stops waiting on reporting
Late journals appear in the figures without a re-run, so the queries that normally surface on day four surface on day one. The close is bounded by the accounting, not by the reporting cycle.
Finance stops being a help desk for its own numbers
Budget holders answer their own questions instead of raising them. The analyst hours currently spent producing one-off extracts go back into analysis.
A reorganisation stops becoming a reporting project
No mapping exercise, no restatement, no parallel version of the truth. The structure changes; the ledger beneath it does not, and every comparative still works.
Being useful stops costing more
With no per-seat charge, giving every budget holder their own numbers is a decision, not a business case. Adoption never appears on the invoice.
Reorganisation-proof reporting
Your business changes. Your history should not.
Every reorganisation rewrites the org chart. None of them should rewrite your reporting. In Wevo the structure is a lens over the ledger rather than a shape baked into it - so the same postings can be read through whichever structure answers the question in front of you.
A reorganisation, in January
Last year
Europe ├ Germany ├ France └ Spain
This year
Continental Europe ├ Germany & Austria ├ France └ Iberia
In March the board asks what Continental Europe delivered last year. In most systems that is a mapping exercise, a restatement, or a spreadsheet nobody wants to own. In Wevo it is a setting.
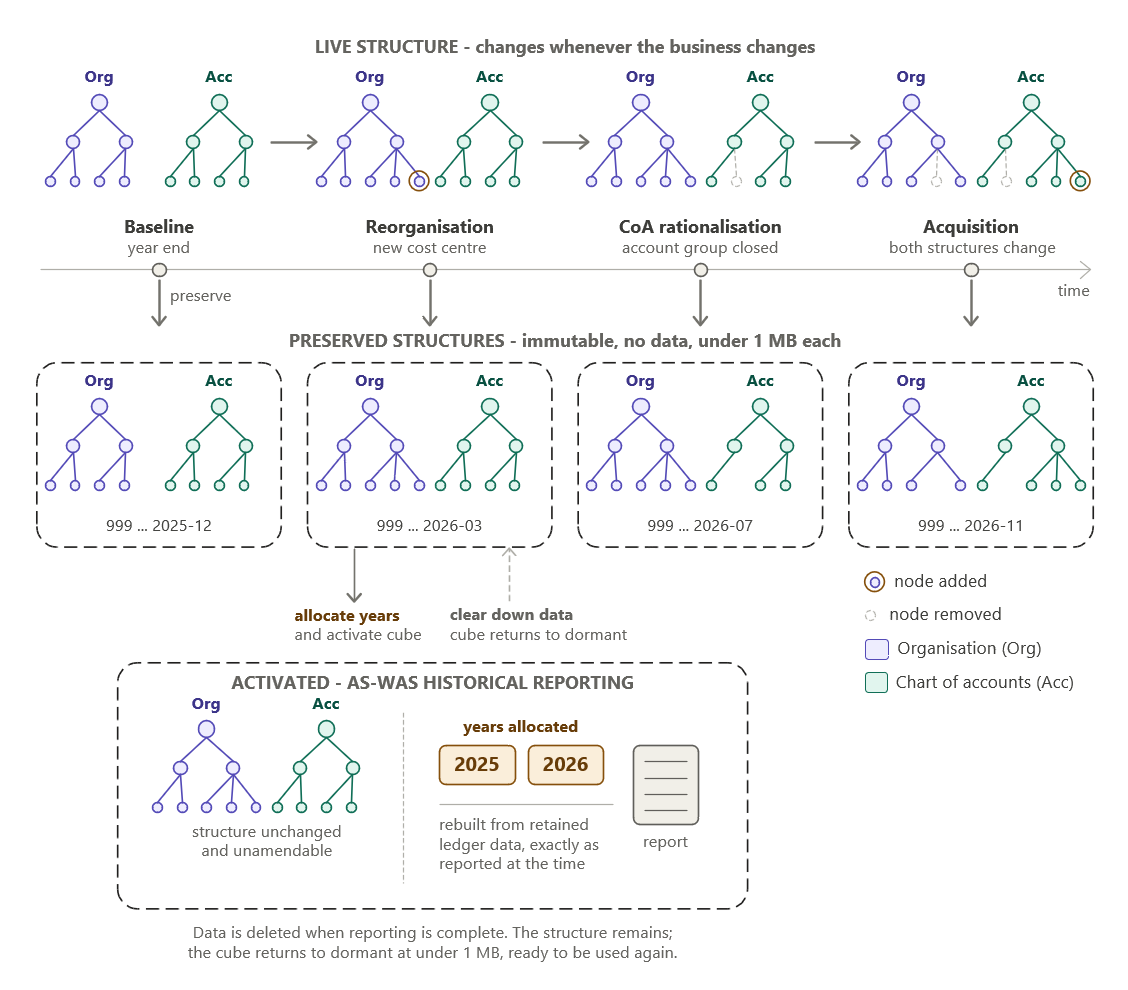
Structure preserved at every change · activated only when asked
Read history as it is now
Read prior years through today's structure for a true like-for-like comparison - automatically, with no mapping exercise and no restatement.
Or as it was then
Or read them through the structure in force at the time, exactly as originally reported - the answer an auditor or a board paper needs.
Preserve before a change
One click takes a permanent, locked copy of your structures as they stand today. Under 1 MB and holding no data, so preserving before a merger or a year end is routine, not a project.
Why change
What you put up with today,
and what replaces it
Wevo is not another dashboard and not an ERP replacement. It is the management reporting layer your existing systems were never designed to be.
| The usual approach | With Wevo |
|---|---|
| Reporting is a night behind the ledger. | Reporting is minutes behind the ledger. |
| Finding what is behind a number means an export and a spreadsheet. | One click from any figure to the transactions beneath it. |
| IT changes the reporting structures, on IT's timetable. | Finance owns the structures and changes them itself. |
| You can answer the questions someone anticipated when the report was built. | You can start at any number and follow it wherever it goes. |
| Your ledger shows where a balance ended, not how it got there. | A time-stamped history of the figures you choose, ready for your own analytics and AI. |
| Everyone who needs a figure needs a licence seat. | Unlimited readers, and reports by email for those who never log in. |
| A reorganisation means restating history and rewriting reports. | The structure changes; the postings and the comparatives do not. |
| The more people use it, the more it costs. | One fixed monthly fee, whatever adoption does. |
How it works
A reporting layer over the
General Ledger you already run
Wevo never touches your GL database. Your system exports a file; Wevo checks it, loads it, and adds up every posting through your structures. Nothing is replaced and nothing is migrated.
Wevo complements the consolidation, EPM and BI tools you already run - answering the management reporting question none of them were designed for.
How the data reaches Wevo
-
1
Your GL exports a file
Balances and movements land in a folder as ordinary CSV files, on whatever schedule suits you.
-
2
Wevo loads and checks it
New files are picked up automatically, validated against your structures, and loaded with no downtime.
-
3
Every total is worked out in advance
Postings are added up through your divisions, cost centres and account groups, so every total already exists before anyone asks for it.
-
4
Finance clicks straight through
Your team moves through the structure and clicks any figure to reach the detail behind it - or has the report emailed to them.
The question procurement will ask
"What happens to us
if the supplier does not?"
It is the right question to ask of any reporting platform, and most vendors answer it with an escrow clause. Wevo answers it at installation.
The source code is yours
Supplied in full at installation under a Continuity Licence, so you can keep running and maintaining the product whatever happens to the vendor. Stronger than escrow, and a ready-made exit-strategy document for regulated procurement. See the detail →
It runs inside your own estate
Cloud, hybrid or fully on-premise, with no licence check, no telemetry and no cloud dependency. Nothing calls out, so nothing stops working if we do.
Nothing proprietary underneath
Open standards, no proprietary runtime and no database vendor tie. Your data, your deployment, your infrastructure - none of it is held hostage to the product.
The price is published
One fixed monthly fee from £5,000, set out in full on the website. You will not sit through a qualification call to find out what it costs. See pricing →
The idea is not new. An earlier generation of this product ran on the mainframe and was bought by two of Scotland's largest banks. Wevo rebuilds that hard-won ground as a modern platform that runs on one ordinary server.
"Your ledger records what happened. Wevo decides how you read it - today's structure, or the one you reported under three reorganisations ago."